So, is this my last look at the disastrous 2016 election results for Paul Simpson’s Harris County Republican Party before offering promised solutions? Maybe. We’ll see.
As I said in the previous look at the HCRP’s disastrous results, I don’t think that Republicans in Harris County understand how bad it really, truly was. I still see people saying that it’s okay, we’ll do better in 2018, it’s all Trump’s fault, yada yada, yada. The level of delusion is fairly amazing if you ask me. And no, I do not think that Paul Simpson is 100{997ab4c1e65fa660c64e6dfea23d436a73c89d6254ad3ae72f887cf583448986} at fault for the disaster although it is a given that he must bear the brunt of the blame. It is very disappointing that he is, publicly at least, trying to shift the blame and not taking any responsibility for it. Oh well.
In this data exercise, we are going to look at the county from a State Representative District and County Commissioner Precinct by State Rep straight party voting perspective. That’s a long sentence to say that the charts below should be self explanatory but if not, think about your State Rep and your County Commissioner and how they affected (or didn’t affect) the 2016 general election in Harris County.
Lots of data, not much commentary because I really, truly want other people to chime in via comments or email. I understand that many people don’t want to put their thoughts out publicly, so email is okay. And as usual, I won’t make your email public unless I ask you. And I promise that I will have plenty of commentary and specific suggestions in the very near future. For now, I prefer to continue thinking about it and talking to various HCRP players.
When you look at the data, remember that redistricting happened between the 2010 and 2012 elections. I’ve chosen to use the party affiliation and name for incumbents entering the 2016 election. Let’s get started.
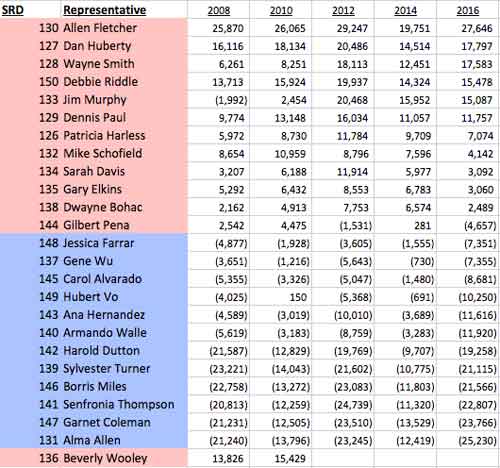
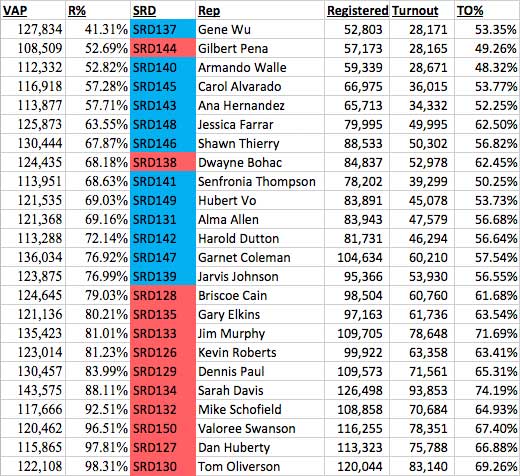
First up, total ballots cast 2008 – 2016 by State Rep district sorted by 2016 high to low:

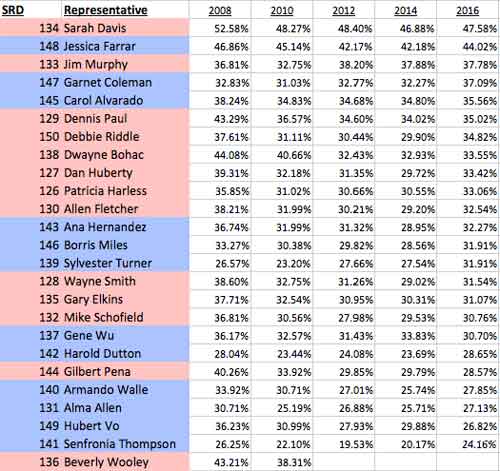
Wow, you’d think that the R’s would have wiped out the D’s by looking at that table. Let’s look at the turnout percentages:

Interesting. The R district vs D district turnout is very close to total ballots cast, again indicating that Republicans should have cleaned the Democrat’s clock. And wow, Sarah Davis’ district must rock for Republicans! Right?
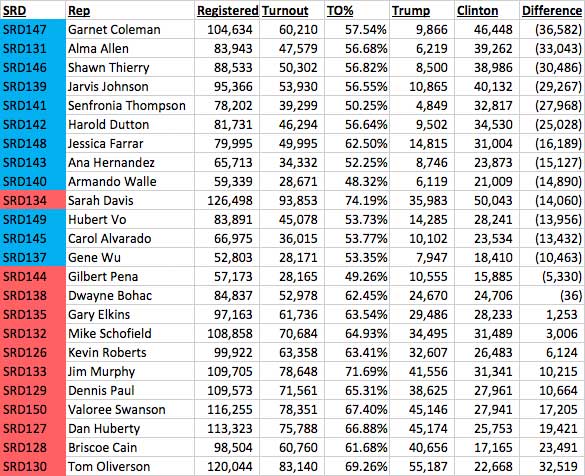
Now that you’ve seen the total ballots and turnout percentage, let’s take a deeper dive into straight ticket voting. Because, you know, that was Paul Simpson’s campaign theme in a nutshell – Harris County Works! Vote straight Republican and go home! This table shows each State Rep district sorted by the straight ticket Republican vote for each district:

Huh. The districts are staring to shift a bit. Now let’s show a table sorted by the net (R straight votes minus D straight votes) straight ticket vote between Republicans and Democrats:
Oops. Looks like the high turnout in a more than a couple of R State Rep district didn’t translate into a straight ticket voting for R’s onslaught.
Now let’s look at the State Rep districts in terms of ‘Independent’ or non-straight ticket voting:
There is a whole lot of strategy packed into that table if you choose to see it. But if you are a consultant from Austin advising Paul Simpson, you probably don’t.
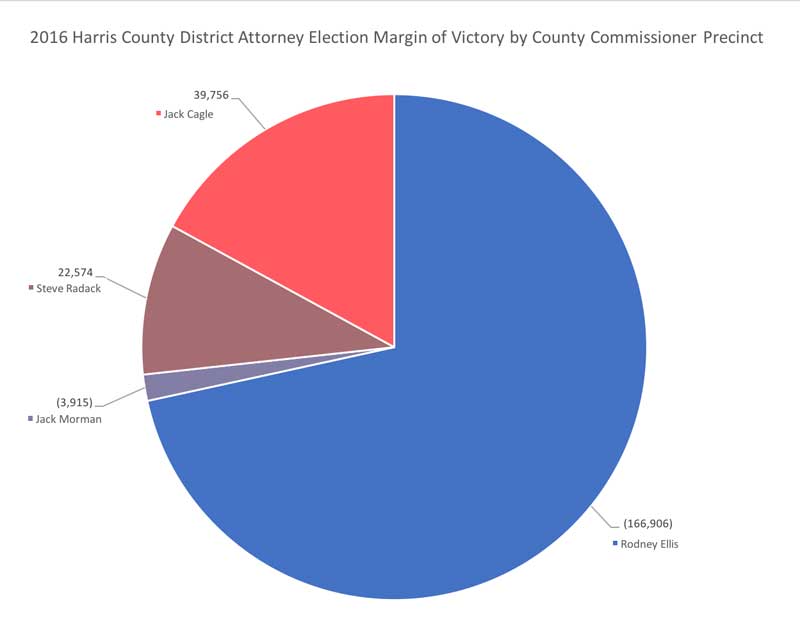
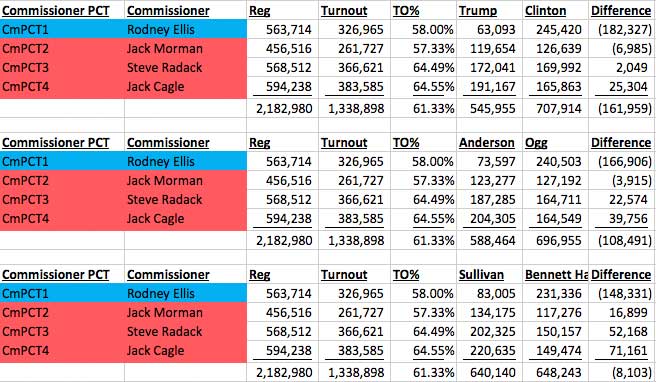
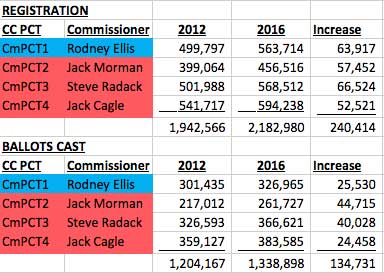
I thought it might be interesting to take another look at the voting by County Commissioner Precinct, this time in terms of State Rep districts.
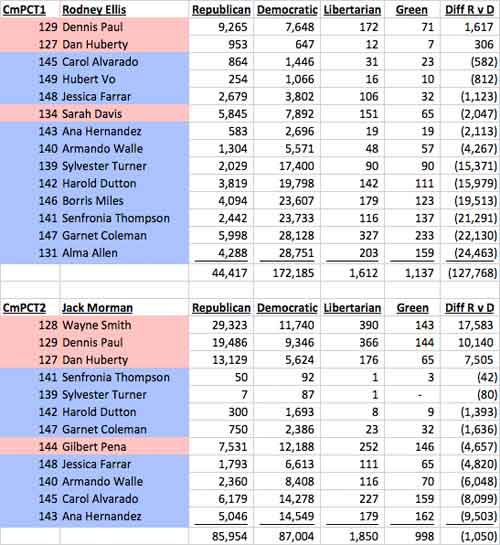

Once again, a whole bunch of strategy outlined in those tables. But hey, I’m just a blogger! What do I know?
And of course, we have to know how the County Commissioner precincts did in terms of net difference between R’s and D’s in straight ticket voting. Because, you know, we have to know!


And as we saw earlier, Harris County County Commissioner Precinct 1 swallows up the other three in favor of Democrats.
Okay, that’s enough for today. Like I said, I’ll keep thinking about it but I’ve dropped enough hints and clues here for anyone that is paying attention to know what I’m going to say.
And here is another clue but maybe one you didn’t think of. The Sarah Davis that won in 2010 on a Tea Party, anti-Obamacare wave is not the Sarah Davis that won in 2016 on a platform of pro-abortion, pro-LGBT causes. Think about that real hard.
Adios, for now.


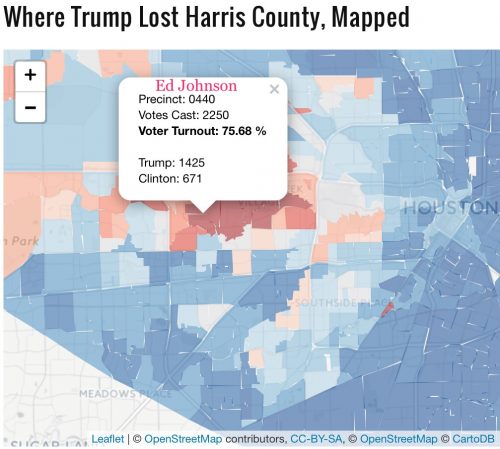
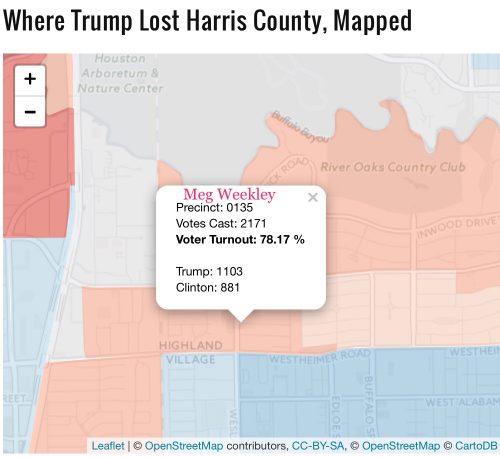
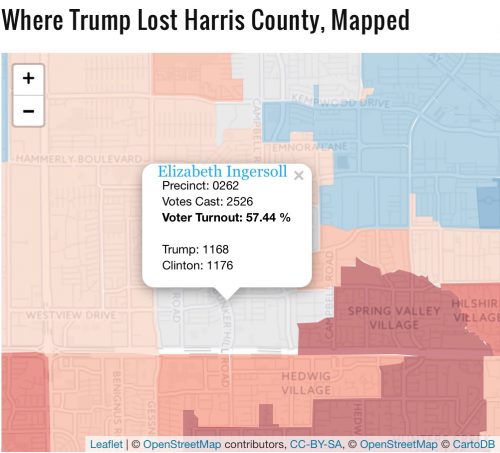
 precinct made an impact on the results for DJT. These are “close in” Westside Republican precincts and what I consider to be the heart of where I look for Republican election results. You can tell what is going to happen to Republican voting in Harris County by watching this area.
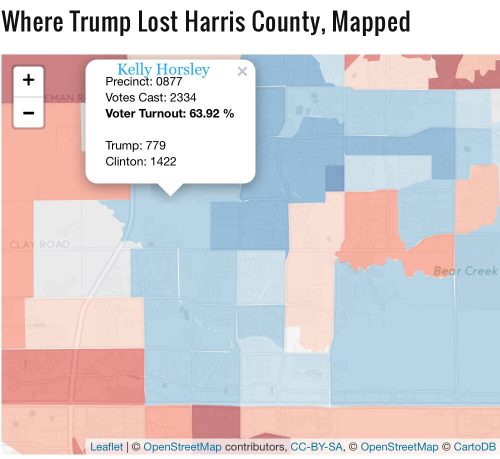
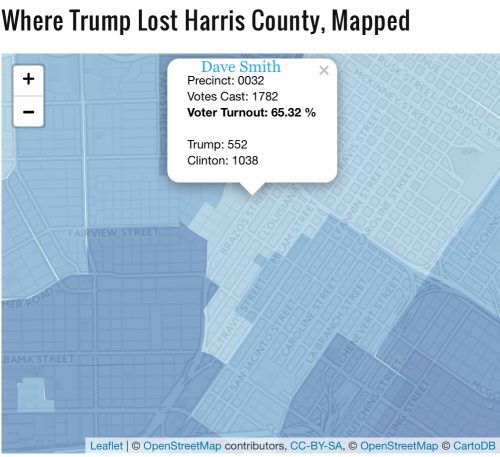
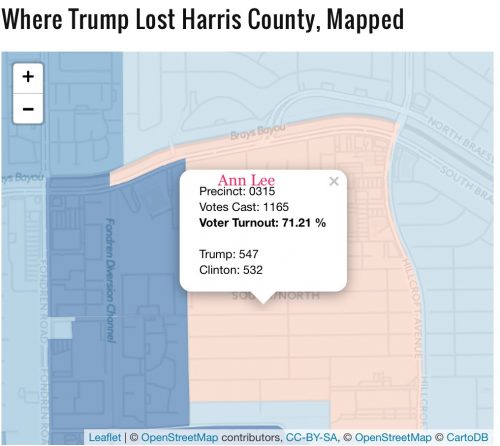 – the party’s version of local control. Every politician in the state darkened their doorsteps. It is an anachronism of times past. The local community-oriented precinct structure was a successful model for years. I say all this because, of course, in a sea of blue, Ann Lee won her precinct for Trump. Ann Lee’s precinct is just west of Meyerland by the Jewish Community Center and dominated by Clinton precincts on all sides. Ann Lee was a strong Trump supporter and a convention delegate. We sit next to each other at the Downtown Pachyderm and never do I fail to learn something from her and her great spirit.
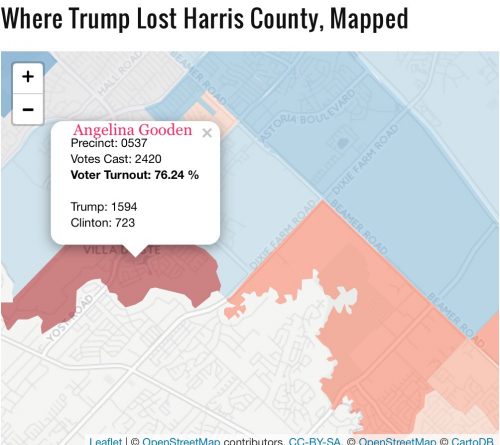
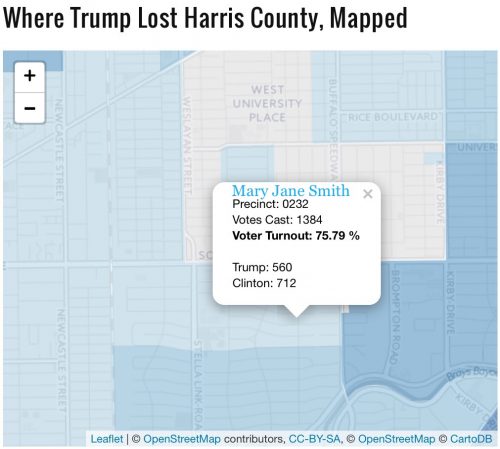 have become increasingly hostile to Israel and the country’s political leaders. Conversely, Evangelicals and the Christian right fight to protect Israel. Let’s take a look at the power hook and see what happened to some precincts headed by local party activists. Not surprisingly, Mary Jane Smith lost her precinct to Clinton. My guess is that MJS worked against Trump. The residents of Mary Jane Smith’s precinct can tell you what her message was for Trump. Experience has told me not to listen to her.
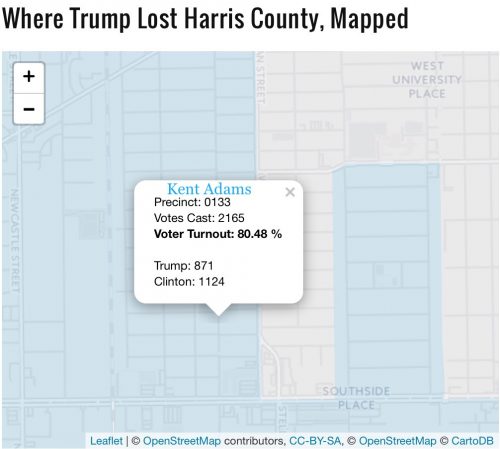


 Dear Friends,