We’ve already established that the 2016 General Election was a disaster for the Harris County Republican Party. Okay, we didn’t really have to establish that, all we had to do was look at the results. As in zero candidates winning. That’s pretty bad, right?
Frankly, I don’t think that the Republicans in Harris County that I talk to understand how bad it was. Of course, most of those people are ‘insiders’ and their real goal is to protect their turf. Or reputation. By making excuses for the outcome. Or, in a few cases, blaming the leadership of the party. Or, in a lot of cases, blaming the top of the ticket, as in President-elect Donald Trump for the poor showing.
It is interesting to me that most of the ‘man or woman on the street’ types that I talk to (i.e. those people that have lives and don’t worry about this stuff) don’t care at all the Harris County Republican Party. All they know is that Trump won (yippee!) or Trump won (yikes my life is over!). There doesn’t seem to be much middle ground between the two extremes. But that is probably a subject for later.
For now, we still need to figure out why the HCRP got wiped out. And the only way to do that objectively is to look at the data from the election. You can’t simply say ‘Never bet against Trump!‘ if you want to change the results for Republicans in Harris County.
The more I review the data, the more the answer becomes clear. If you go back and read the previous posts about the outcome, I’d bet that most of you see what I see. Instead of pointing it out, all I’m going to do is give you data from the official canvass report. If you are new to Harris County or new to thinking about political results in general, it might be harder for you to see but hang in there, the answers are clear. As well as the solution. Never present a problem without a solution, right? So look for it and then we’ll compare notes later.
Let’s start with the results in Harris County by Congressional District. Harris County has a total of 9 Congressional districts but only 4 of them are wholly in the county (CD2 – Ted Poe, CD7 – John Culberson, CD18 – Sheila Jackson Lee, and CD29 – Gene Green). Red for Republicans, blue for Democrats.
Let’s sort it by turnout percentage:
Some of you will no doubt notice that the Democrats have the lowest turnout percentage but their margins for Clinton are so large that they carried the day. Think about that for a bit and what it means for the future.
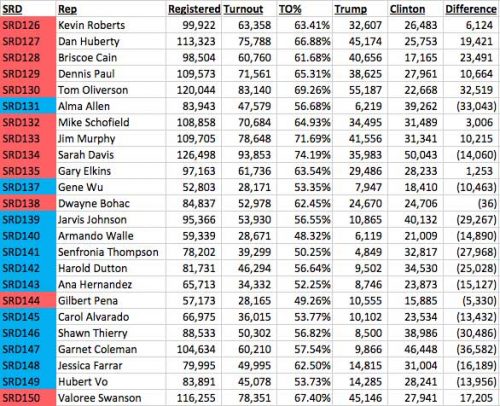
But hey, those are Congressional Districts! What about something closer to home like State Representatives? Surely Republicans can find some positives there. Harris County has 24 State Rep districts. Prior to the election, they were split 50/50. With Gilbert Pena’s loss, the Democrats now have a 13-11 advantage. For these purposes, Pena will be in highlighted in red because he is the incumbent.
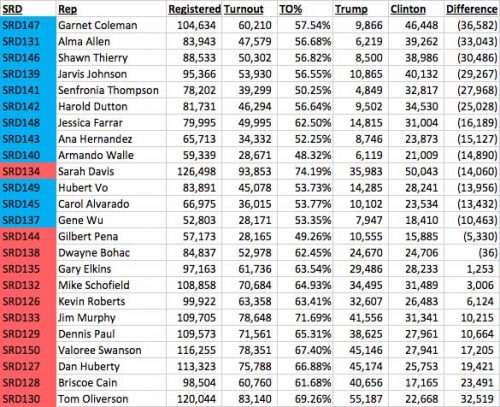
Let’s take a look at those same districts sorted by margin of victory for Clinton.
Even though the split is 12-12 prior to the election, Clinton won 15 of the districts. And Clinton fared better in vote difference in Republican Sarah Davis’ district than she did in three Democratic strongholds. Interesting.
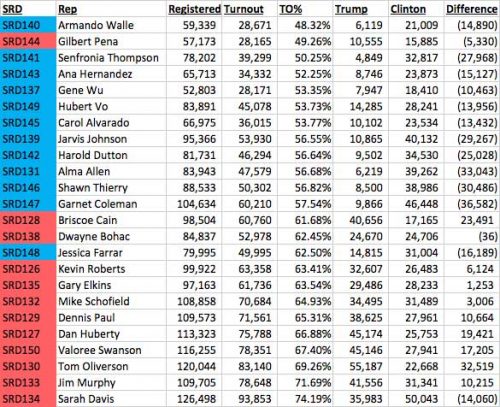
Let’s look the same dataset by turnout:
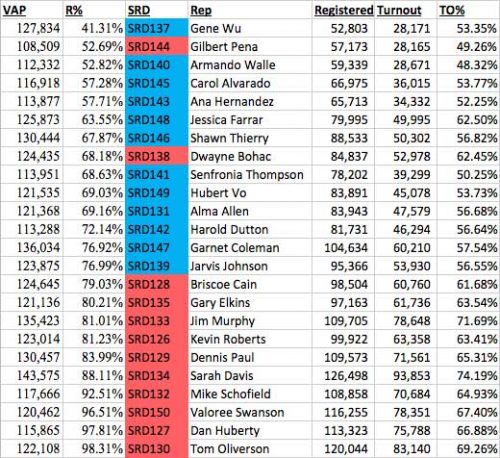
Only one Democratic State Rep district had a turnout percentage greater than 60%, Jessica Farrar in SRD148. What does this mean for the future? Let’s look at the growth potential for the districts:
A couple of things stand out. First, let’s get on the same page. The VAP is the Voting Age Population for the district. The R% is the percentage of the VAP that is registered to vote. The table is sorted by R%, lowest to highest. Lots of blue in those low R% areas (I gave you a hint for a solution).
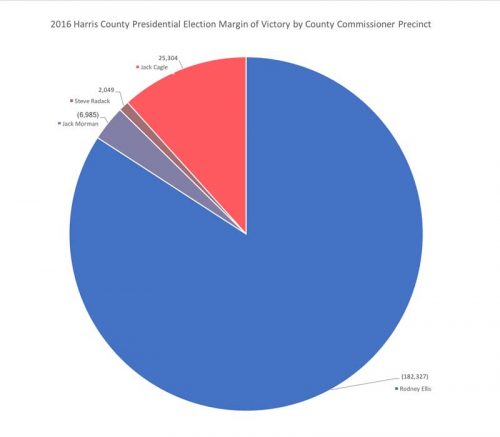
The most striking example that I found when reviewing the data was what happened in the vote by County Commissioner Precinct. Let’s take a look at how Trump did by CC Precinct.
Rodney Ellis’ Precinct 1 vote in favor of Clinton swallowed the other commissioners whole. Jack Morman’s Precinct 2 went for Clinton. Steve Radack’s Precinct 3 was basically a wash. Only Jack Cagle’s Precinct 4 delivered for Trump.
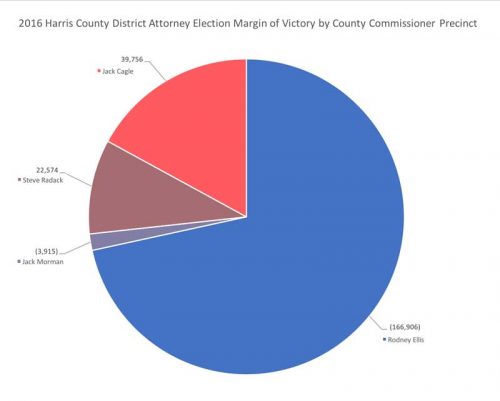
But, but, Trump sucked as a candidate you say! I hear you, so I did the same chart for the District Attorney’s race. I like that race because only a die-hard Republican would vote for Devon Anderson.
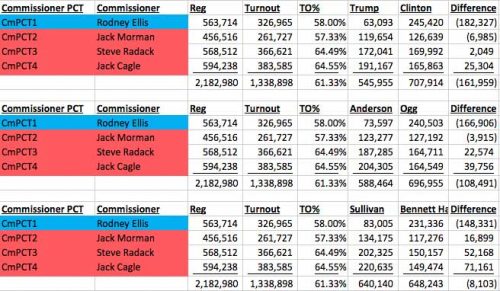
Again, Precinct 1 swallows the Republican precincts. Think about that, I promise it will come up in a test later. If you want the actual numbers, here you go, including the Tax Assessor Collector race:
Even in the Tax Assessor Collector race, Precinct 1 wins the day. Why?
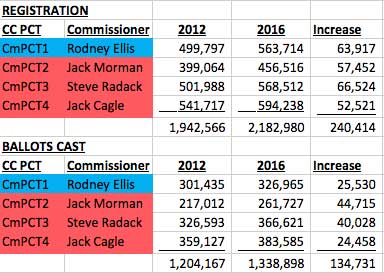
One last bit of data for you to ponder. What about new voters? Where were they?
Are you seeing what I’m seeing? What path should the HCRP take going forward?


Could we see the exact same data, but for 2014?
Why did Harris County Republicans do so well in a Gregg Abbott year, and so poorly in a Donald Trump year?
I would caution against making comparisons based on voter turnout rates. Lower income, minority, Democratic districts may have voter rolls which are less lean than those in more wealthy, educated, homeowner-based Republican districts. I have seen some anecdotal data to support this hypothesis, but no full-blown studies.
Mainstream,
I don’t understand your comment. Will you elaborate?
DJ
I think the argument is that low-income areas have a more transient population and this distorts the turnout rate.
People will register to vote but then move away. Voter rolls then are filled with names of people who can’t vote in the district. Therefore, the ratio of actual voters to registered voters appears worse than than in higher-income areas.
Informative and great analysis David, and thank you. You must have put a lot of effort into compiling this data, and I appreciate it.
This is a great article and I thank you for the work applied to it.
You’ve understood for years what these election results tell us. Unfortunately, so many pay so little attention to it. With no political experience at all, I predicted that 2016 in Harris County would be a repeat of 2008, only worse for the Rs.
And that’s what happened.
To the person who asked why 2014 was different, the answer is that it wasn’t a presidential election year.
There were two exceptions to all Republicans lost. Both Republican candidates for Trustee of the Harris County Department of Education won. Reform of the Department begins in January.
Those weren’t county wide races. Republicans did as expected in races for specific districts.