So, is this my last look at the disastrous 2016 election results for Paul Simpson’s Harris County Republican Party before offering promised solutions? Maybe. We’ll see.
As I said in the previous look at the HCRP’s disastrous results, I don’t think that Republicans in Harris County understand how bad it really, truly was. I still see people saying that it’s okay, we’ll do better in 2018, it’s all Trump’s fault, yada yada, yada. The level of delusion is fairly amazing if you ask me. And no, I do not think that Paul Simpson is 100{997ab4c1e65fa660c64e6dfea23d436a73c89d6254ad3ae72f887cf583448986} at fault for the disaster although it is a given that he must bear the brunt of the blame. It is very disappointing that he is, publicly at least, trying to shift the blame and not taking any responsibility for it. Oh well.
In this data exercise, we are going to look at the county from a State Representative District and County Commissioner Precinct by State Rep straight party voting perspective. That’s a long sentence to say that the charts below should be self explanatory but if not, think about your State Rep and your County Commissioner and how they affected (or didn’t affect) the 2016 general election in Harris County.
Lots of data, not much commentary because I really, truly want other people to chime in via comments or email. I understand that many people don’t want to put their thoughts out publicly, so email is okay. And as usual, I won’t make your email public unless I ask you. And I promise that I will have plenty of commentary and specific suggestions in the very near future. For now, I prefer to continue thinking about it and talking to various HCRP players.
When you look at the data, remember that redistricting happened between the 2010 and 2012 elections. I’ve chosen to use the party affiliation and name for incumbents entering the 2016 election. Let’s get started.
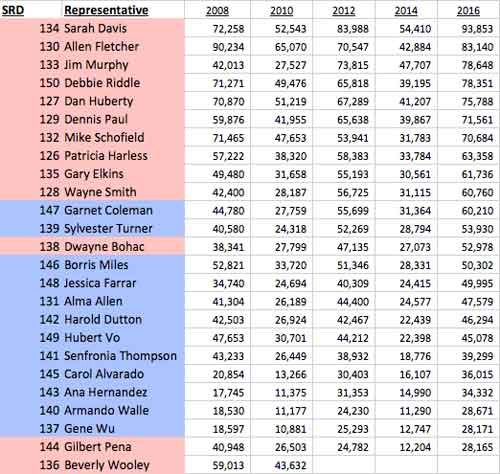
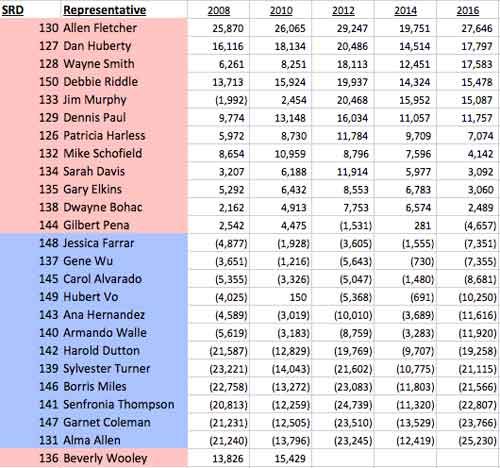
First up, total ballots cast 2008 – 2016 by State Rep district sorted by 2016 high to low:
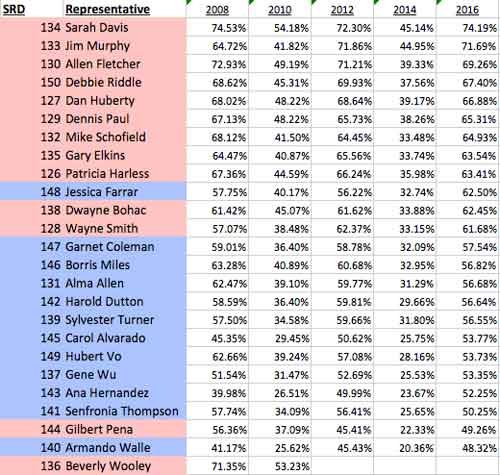
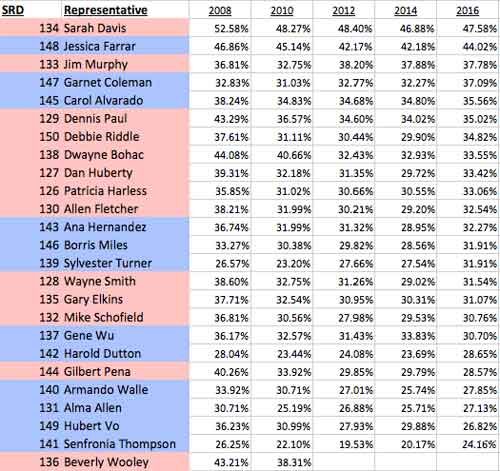
Wow, you’d think that the R’s would have wiped out the D’s by looking at that table. Let’s look at the turnout percentages:
Interesting. The R district vs D district turnout is very close to total ballots cast, again indicating that Republicans should have cleaned the Democrat’s clock. And wow, Sarah Davis’ district must rock for Republicans! Right?
Now that you’ve seen the total ballots and turnout percentage, let’s take a deeper dive into straight ticket voting. Because, you know, that was Paul Simpson’s campaign theme in a nutshell – Harris County Works! Vote straight Republican and go home! This table shows each State Rep district sorted by the straight ticket Republican vote for each district:
Huh. The districts are staring to shift a bit. Now let’s show a table sorted by the net (R straight votes minus D straight votes) straight ticket vote between Republicans and Democrats:
Oops. Looks like the high turnout in a more than a couple of R State Rep district didn’t translate into a straight ticket voting for R’s onslaught.
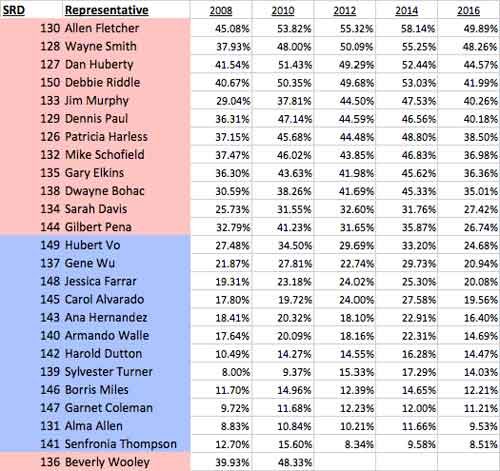
Now let’s look at the State Rep districts in terms of ‘Independent’ or non-straight ticket voting:
There is a whole lot of strategy packed into that table if you choose to see it. But if you are a consultant from Austin advising Paul Simpson, you probably don’t.
I thought it might be interesting to take another look at the voting by County Commissioner Precinct, this time in terms of State Rep districts.
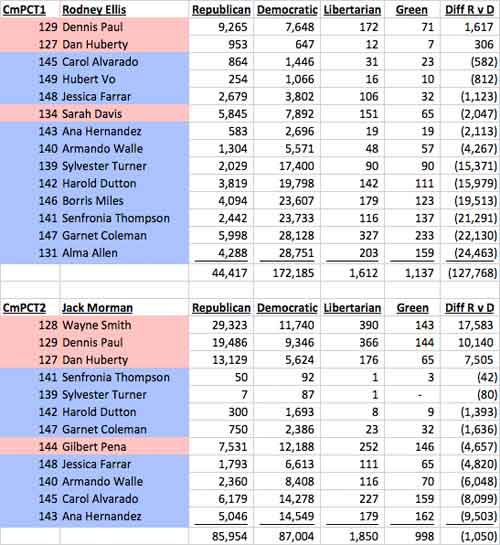

Once again, a whole bunch of strategy outlined in those tables. But hey, I’m just a blogger! What do I know?
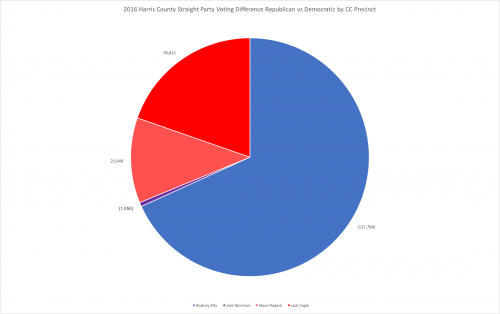
And of course, we have to know how the County Commissioner precincts did in terms of net difference between R’s and D’s in straight ticket voting. Because, you know, we have to know!
And as we saw earlier, Harris County County Commissioner Precinct 1 swallows up the other three in favor of Democrats.
Okay, that’s enough for today. Like I said, I’ll keep thinking about it but I’ve dropped enough hints and clues here for anyone that is paying attention to know what I’m going to say.
And here is another clue but maybe one you didn’t think of. The Sarah Davis that won in 2010 on a Tea Party, anti-Obamacare wave is not the Sarah Davis that won in 2016 on a platform of pro-abortion, pro-LGBT causes. Think about that real hard.
Adios, for now.

Nice post
I keep seeing these posts and I keep getting loster and loster. Really looking forward to the Kindergarten-level answer key that I apparently need, because this is just hurting my head.
Make that two of us. Usually the analysis is given with the data held in reserve to support the conclusions drawn. When it’s presented the other way, you assume a level of expertise and local knowledge (which are not related to the level of interest in this topic) that are lacking from those of us who do not immerse ourselves in local politics, but still want to understand what is going on.
Look at HD 134
Here’s a couple of things jotted down on the back of a napkin that stand out for me:
1. “Independents” or non-straight ticket voters make up approximately a third of the voters in these races. – Republicans need to tailor their message to address the concerns of these Independents in order to persuade them to support Republicans.
2. Republican districts have a higher percentage of Independents than Democrat districts. – Democrats may have more party loyalty/discipline, and/or Republicans need to increase outreach to independents and convert them to Republicans to continue to win elections.
3. Republican districts appear to have higher turnout than Democrat districts. – Reliable Republican voters are already activated and engaged in elections, with little opportunity to increase their numbers by turnout. Democrats appear to have significant opportunities to increase their numbers of reliable voters just by increasing turnout.
4. Republican districts are more competitive on average than Democrat districts. – Democrat districts are literally packed with high numbers of reliable D voters. There is very little opportunity for Republicans to capture these districts, but further concentration of D voters into these same districts may help Republicans to maintain a majority of the districts countywide.
5. Concentrating (segregating?) D voters into D districts gives the false impression that R voters are a majority countywide. – By increasing turnout D voters can have a significant impact on countywide races, that appear to be disproportionate to the results in district elections due to gerrymandering of district boundaries.
Thank you James, that is the type of observation I was hoping for. Your #5 is particularly interesting. And #3 is very concerning.
DJ
I liked Sarah Davis and her husband. I supported her in 2010 but not thereafter. Sarah began to move away from her 2010 presumed pro-life, conservative stance on social issues very early. I admit I was surprised because she was a Baylor graduate (The Sumners family has five recent Baylor grads). I don’t know if she was faking it in 2010 or thought changing her positions would benefit her in reelections. Either way, her bad.