In the introductory article, I explained why I believe it is important to examine what happened in the 2026 election before deciding what Republicans should do differently.
Before we can meaningfully discuss why Republicans lost, we need to establish what the election results actually show.
That requires more than looking at percentages, comparing winners and losers, or selecting a particular election that supports a preferred explanation.
For this analysis, I am examining several different measurements of Republican and Democratic electoral performance in Harris County. Each provides useful information, but each also has limitations.
Methodology: What Are We Measuring?
The primary comparison involves four election cycles:
- 2018: A gubernatorial midterm election in which Democrats made substantial gains.
- 2022: A gubernatorial midterm election in which Republicans performed considerably better.
- 2024: A presidential election, providing a useful comparison for voter participation and the size of each party’s potential electoral coalition.
- 2026: The election we are attempting to understand.
2020 was excluded because of COVID and concern for differing results in voting method. I have not looked at those results.
The results use several principal measurements.
First, raw votes. How many votes did Republican and Democratic candidates actually receive? Percentages alone can conceal important changes in the number of people voting for each party.
Second, voter participation. How many registered voters participated in each election? This helps distinguish changes in the overall electorate from changes in the distribution of votes between candidates.
Third, countywide judicial elections. I am examining contested civil and criminal district court races to establish a broader measure of Republican and Democratic performance rather than relying exclusively on a single statewide candidate.
For judicial comparisons, the result is the average votes received by Republican and Democratic candidates in contested races within each category. These are averages per race, not the sum of votes across multiple races. The number of contested judicial races changes between election years, so comparisons involving identical courts are especially valuable.
Fourth, candidate-specific differences. I am comparing Republican candidates appearing on the same ballot to identify differences in Republican support, including the potential impact of voters unwilling to support Donald Trump.
Fifth, statewide comparisons. Harris County does not exist in isolation. If Republican performance changes similarly throughout Texas, we should be cautious about attributing the entire change to something unique to Harris County.
Finally, geographical and voting-method comparisons. Subsequent articles will examine individual Texas House districts, smaller geographic areas, and differences between mail voting, early in-person voting, and Election Day voting.
One additional methodological point is important: Texas does not register voters by political party. Consequently, a Republican candidate’s vote total is not the same thing as the number of Republicans who turned out.
We cannot automatically determine whether a change reflects different voters participating, voters switching candidates, or some combination of both.
All 2026 figures discussed here are preliminary and subject to revision following the official canvass.
Harris County: The Raw Numbers
The starting point is the Republican and Democratic vote in the gubernatorial and presidential elections.
| Election | Republican | Democratic | Turnout |
|---|---|---|---|
| 2018 Governor | 559,819 | 628,804 | 51.7% |
| 2022 Governor | 490,261 | 595,653 | 42.9% |
| 2024 President | 722,695 | 808,771 | 58.2% |
| 2026 Governor | 483,850 | 879,134 | 50.7% |
Turnout is calculated as total ballots cast divided by the registered-voter figures used in the Texas Secretary of State’s historical election comparisons, not merely the votes cast for the two major-party candidates.
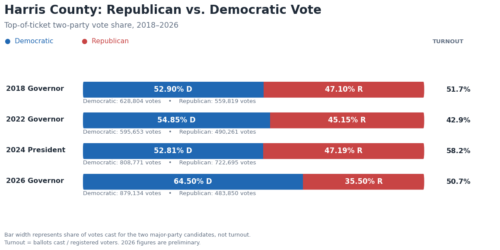
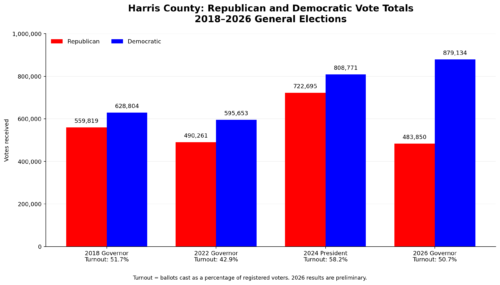
The most useful initial comparison is between 2022 and 2026, because both were gubernatorial midterm elections.
Between those elections:
- Republican gubernatorial votes decreased by 6,411, or approximately 1.3%.
- Democratic gubernatorial votes increased by 283,481, or approximately 47.6%.
Those numbers deserve attention.
Republicans did not lose 200,000 or 300,000 votes compared with the previous gubernatorial election. Governor Abbott received approximately the same number of votes.
Meanwhile, the Democratic candidate received nearly 284,000 additional votes.
That is an extraordinary difference in the direction and magnitude of the changes.
It does not establish why those additional Democratic votes appeared. Nor does it establish that every person who voted Republican in 2022 returned in 2026.
But it tells us that we cannot adequately explain the election merely by pointing to a large decline in the Republican raw vote.
Was Democratic Participation Comparable to a Presidential Election?
Another comparison raises an important question.
In 2024, Kamala Harris received 808,771 votes in Harris County.
In 2026, Gina Hinojosa received 879,134 votes.
That is 70,363 more Democratic votes in a midterm gubernatorial election than in the preceding presidential election.
Meanwhile, approximately 175,000 fewer total ballots were cast in Harris County in 2026 than in 2024.
We should not assume that the same individuals cast those Democratic votes in both elections. Nor should we conclude that Democratic turnout alone explains the difference.
Nevertheless, the raw vote comparison is striking.
The Democratic gubernatorial candidate received more votes in 2026 than the Democratic presidential candidate received in 2024, despite substantially lower overall voter participation.
That is a fact we will need to consider when examining the competing explanations for the election.
What About Overall Turnout?
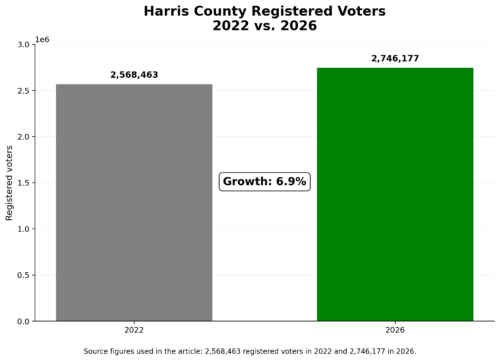
Harris County had approximately 2.57 million registered voters in 2022, compared with approximately 2.75 million in 2026.
That represents roughly 6.9% growth in voter registration.
The number of ballots cast increased from approximately 1.10 million to 1.39 million.
In percentage terms, turnout increased from 42.9% in 2022 to 50.7% in 2026, a gain of approximately 7.8 percentage points.
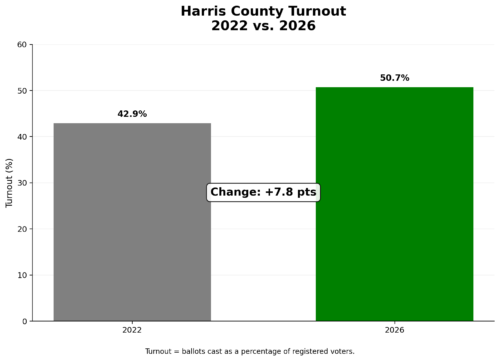
For comparison, turnout in the 2024 presidential election was 58.2%, using the same historical registration-based method.
Thus, 2026 participation was substantially higher than in the previous gubernatorial election, although it remained below presidential-election participation.
This matters because an increase in overall turnout does not necessarily help both parties equally.
The question is not simply whether more people voted.
The question is which candidates benefited from the additional participation, and why.
The Judicial Races: A Broader Republican Baseline
One problem with relying exclusively on the governor’s race is that individual candidates can perform differently from their political parties.
To address that concern, I also examined the countywide civil and criminal district court races.
The following table compares the average number of votes received by candidates in those categories in 2022 and 2026.
| Category | 2022 average | 2026 average | Change |
|---|---|---|---|
| Civil — R | 518,275 | 507,517 | −2.1% |
| Civil — D | 544,761 | 821,421 | +50.8% |
| Criminal — R | 521,216 | 511,963 | −1.8% |
| Criminal — D | 543,145 | 807,605 | +48.7% |
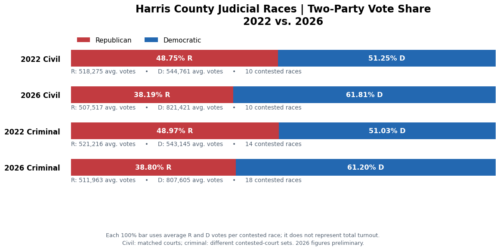
The civil comparison includes the same ten court numbers in both elections. The criminal comparison involves a different number of contested courts, so those averages should be treated as a broader partisan benchmark rather than a perfectly matched candidate comparison.
The pattern is remarkably consistent with the gubernatorial results.
Republican judicial candidates experienced relatively small declines in average raw votes compared with 2022.
Democratic judicial candidates experienced increases approaching 50%.
This suggests that the major change was not confined to the gubernatorial race. It appeared throughout the countywide judicial ballot.
That does not eliminate candidate-specific effects. Some Republican judicial candidates performed noticeably better than others, and those differences may become useful when we examine split-ticket voting.
But the broader countywide pattern is unmistakable.
In the posts that follow this will be used as the base republican vote value.
Where did the Change Occur
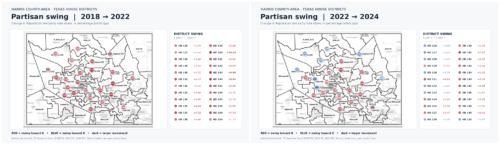
Total numbers are helpful, but they don’t tell the entire picture. We need to look at where the vote change occurs. A proxy for this is looking at the state house districts. In the image below the change in vote shift is shown by the house district.
Measuring the Never Trump Vote
Another issue we need to examine is the potential impact of voters who are willing to support Republican candidates but unwilling to vote for Donald Trump.
For purposes of this analysis, I will refer to this group as Never Trump voters, although the terminology requires some qualification.
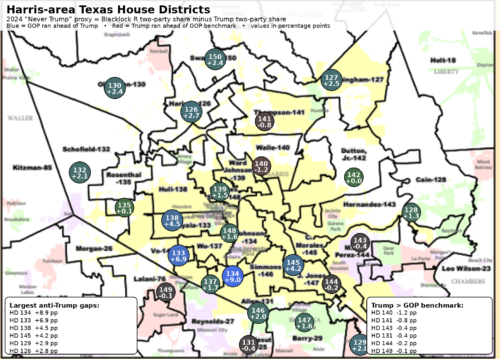
We cannot identify an individual voter as Never Trump simply by looking at election returns. However, we can identify geographic areas where Donald Trump received substantially less support than other Republican candidates appearing on the same ballot.
That difference gives us a measurable starting point. The image below has the districts enlarged for easy viewing and identifying the geography where the Never Trump vote is occurring.
How Never Trump Vote was Calculated
For the 2024 election, I compared Donald Trump’s performance with that of Republican Supreme Court Justice Jimmy Blacklock.
Both candidates appeared on the same general-election ballot, allowing us to compare Republican performance within the same geographic areas and election cycle.
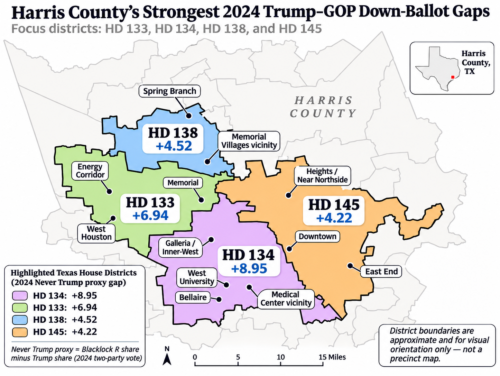
The preliminary analysis identified four Texas House districts with particularly large differences in Republican two-party vote share.
| House District | Blacklock advantage over Trump |
|---|---|
| HD 134 | +8.95 percentage points |
| HD 133 | +6.94 percentage points |
| HD 138 | +4.52 percentage points |
| HD 145 | +4.22 percentage points |
These figures represent Blacklock’s Republican share of the two-party vote minus Trump’s Republican share, calculated separately for each contest.
The differences were not evenly distributed geographically.
Three of the largest gaps occurred in districts encompassing parts of the Bellaire, West University, Memorial, Energy Corridor, and Spring Branch areas.
HD 145, which lies farther to the southeast, also demonstrated a notable difference.
These results suggest that opposition to Trump among voters otherwise willing to support Republican candidates may have been particularly concentrated in certain geographic areas.
However, there are important limitations.
A voter supporting Blacklock and Harris would create precisely this type of difference. But differences in undervoting, third-party participation, and candidate-specific appeal could also contribute to the observed gap.
Consequently, these figures measure Republican presidential underperformance relative to another Republican candidate, not the number of confirmed Never Trump voters.
Does the Pattern Appear in 2026?
The 2026 election provides another opportunity to examine candidate-specific Republican underperformance.
Ken Paxton, whose political relationship with Trump was particularly prominent, received fewer votes than Governor Greg Abbott.
In Harris County:
| Election | Abbott | Paxton | Difference |
|---|---|---|---|
| 2022 | 490,261 | 480,141 | −10,120 |
| 2026 | 483,850 | 451,780 | −32,070 |
Paxton’s deficit relative to Abbott increased by 21,950 votes between the two elections.
Statewide in 2026, Paxton received 275,154 fewer votes than Abbott.
This is potentially relevant to our Never Trump analysis, but it does not establish that opposition to Trump caused Paxton’s underperformance.
Voters could have opposed Paxton for reasons unrelated to Trump, including their evaluations of Paxton himself. Moreover, Paxton was running for attorney general in 2022 and U.S. senator in 2026. Those races involved different offices, opponents, and political circumstances.
Nevertheless, the difference is measurable and warrants investigation.
A useful next step will be to determine whether Paxton’s 2026 underperformance was particularly pronounced in the same geographic areas where Trump underperformed other Republicans in 2024.
If those patterns substantially overlap, that would provide evidence consistent with a persistent group of voters who distinguish between Republican candidates, although it would not establish their individual motivations.
If they do not overlap, alternative explanations would deserve greater consideration.
For now, the important point is that Republican voting behavior is not necessarily uniform across candidates, even within the same election.
In a later installment, we will examine the geography of this voting pattern, its possible magnitude, and what the evidence does—and does not—allow us to conclude about its effect on Harris County elections.
Was Harris County Different From the Rest of Texas?
This is where the statewide comparison becomes important.
Between 2022 and 2026, Republican gubernatorial votes increased statewide from 4,437,099 to 4,524,527, or approximately 2.0%.
Democratic gubernatorial votes increased from 3,553,656 to 5,230,789, or approximately 47.2%.
Compare those figures with Harris County:
| Change, 2022–2026 | Harris County | Texas statewide |
|---|---|---|
| Republican votes | −1.3% | +2.0% |
| Democratic votes | +47.6% | +47.2% |
The Democratic increase in Harris County was almost identical, proportionally, to the Democratic increase statewide.
The Republican change was somewhat worse locally, but the difference was comparatively modest.
Looking at the Democratic share of the two-party gubernatorial vote provides another perspective.
In Harris County, that share increased from 54.9% to 64.5%, a gain of approximately 9.6 percentage points.
Statewide, it increased from 44.5% to 53.6%, a gain of approximately 9.1 percentage points.
In other words, the shift in the two-party vote toward Democrats was only about half a percentage point larger in Harris County than statewide.
Because statewide totals include Harris County, I also calculated the same comparison for the rest of Texas after subtracting Harris County.
Outside Harris County, Democratic gubernatorial votes increased by approximately 47.1%, while Republican votes increased by approximately 2.4%.
The Democratic two-party share outside Harris County increased by approximately 9.0 percentage points.
The contrast is therefore similar even when Harris County is excluded from the statewide benchmark.
That does not establish that local Republican decisions were irrelevant. It does establish that there was a substantial statewide movement that any explanation of the Harris County election must account for.
We will examine this relationship in greater detail in a later article.
Measuring Republican Support Against Registered Voters
Finally, I wanted a measurement that would account for changes in the size of the registered electorate.
For this purpose, I calculated Republican top-of-ticket votes for every 100 registered voters in Harris County and in the rest of Texas, excluding Harris County.
| Election | Harris County | Rest of Texas |
|---|---|---|
| 2018 | 23.75 | 30.49 |
| 2022 | 19.09 | 26.13 |
| 2024 | 26.84 | 35.60 |
| 2026 | 17.62 | 24.80 |
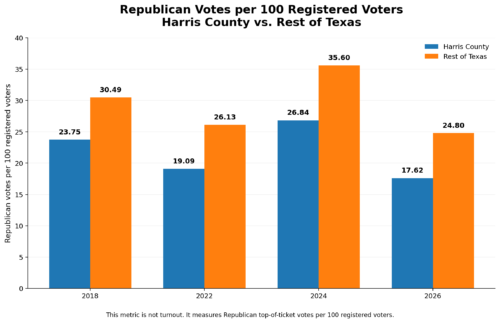
These are Republican candidate votes per 100 registered voters, not Republican voter turnout rates.
Two observations stand out.
First, Harris County has consistently produced fewer Republican top-of-ticket votes relative to its registered electorate than the rest of Texas.
Second, the decline between 2022 and 2026 was similar in both groups.
Harris County declined by approximately 1.47 Republican votes per 100 registered voters. The rest of Texas declined by approximately 1.34.
Consequently, the existing gap between Harris County and the rest of Texas did not change dramatically between these gubernatorial elections.
That raises a separate question: How much of the Republican problem in Harris County reflects circumstances specific to 2026, and how much reflects a longer-standing weakness in Republican electoral support?
What Can We Conclude So Far?
At this point, I believe the numbers establish several useful facts.
Republican candidates in Harris County received slightly fewer votes than in 2022, while Democratic candidates received dramatically more.
The Democratic increase was visible in both the governor’s race and the countywide judicial races.
Overall voter participation increased substantially compared with 2022.
The Democratic gubernatorial candidate even exceeded the Democratic presidential candidate’s 2024 raw vote total.
The broad shift in the Harris County two-party vote was remarkably similar to the statewide shift.
And the candidate-level comparisons suggest that some voters distinguish substantially between Republican candidates, with particularly notable geographic concentrations in the 2024 Trump–Blacklock comparison.
What these numbers do not establish is causation.
They do not tell us whether Republicans lost support because of particular candidates, disagreements within the party, dissatisfaction with national politics, campaign organization, demographic changes, or any combination of those factors.
They also do not tell us how many individual voters changed their preferences rather than simply participating or abstaining in different elections.
Those are questions requiring additional evidence.
Data sources: Texas Secretary of State historical election results, November 2026 preliminary election returns, voter-registration figures, and Harris County countywide election results. Percentages, judicial averages, and district comparisons are calculated from those records. Figures current as of November 10, 2026, and subject to revision following canvass.
Primary reference sources: Texas Secretary of State Election Results and Harris County Historical Voter Registration and Turnout.

Leave a Reply