


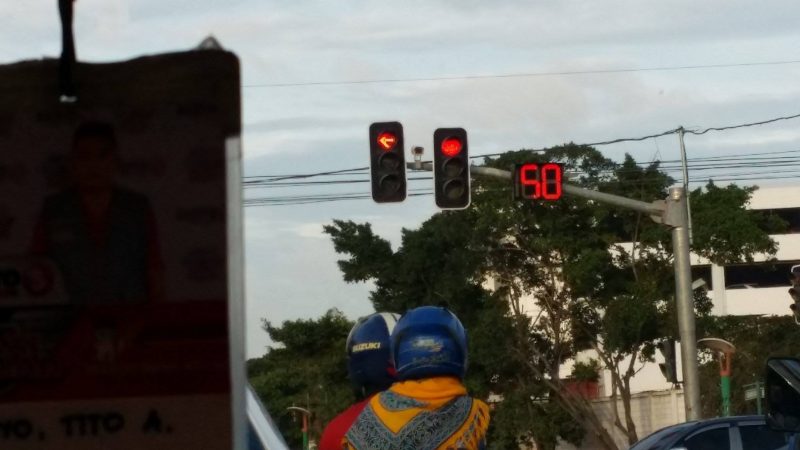
Cebu, Philippines, and the immediate suburbs are about a million people. Traffic there makes Houston’s traffic seem smooth and calm. Mandaue City is an immediate suburb that shares in the area’s traffic woes. However, Mandaue City has implemented a state of the art traffic control system which, by local reports, caused a significant improvement in traffic flow. A local blog about the system can be found here.
The short version is the city connected cameras to the traffic lights via fiber optic cables, and the images are sent to a central traffic control station. The lights are interconnected and controlled by the traffic control station which can change signal duration on the fly. The duration is displayed on a timer that counts down similar to a crosswalk timer. The purported benefits are 1) less congestion 2) saving 10 gallons/year in fuel consumption per vehicle and 3) crime deterrence. Establishing a similar system in Houston will help reduce surface street congestion, but won’t do anything to help the highways.
Having less congestion and reduced fuel consumption is nice. However, crime deterrence is where significant impact can be felt. Houston has a significant no/expired auto insurance problem, and a significant hit and run problem. The following tables quantify the problem. They were provided by TxDOT pursuant to the requirements of the federal highway safety laws and are subject to the disclaimer at the end of the post.
In order to be a reportable accident either $1,000 in damage or an injury occurred.
Hit-and-Run
| Crash Year | Fatal Crashes | Incapacitating Injury Crashes | Non-Incapacitating Injury Crashes | Possible Injury Crashes | Non-Injury Crashes | Unknown Injury Crashes | Total Crashes |
| 2010 | 21 | 60 | 334 | 863 | 3,263 | 798 | 5,339 |
| 2011 | 23 | 59 | 312 | 920 | 3,636 | 759 | 5,709 |
| 2012 | 15 | 106 | 479 | 1,332 | 4,771 | 1,048 | 7,751 |
| 2013 | 28 | 79 | 495 | 1,359 | 5,538 | 1,187 | 8,686 |
| 2014 | 33 | 108 | 560 | 1,605 | 6,590 | 1,221 | 10,117 |
| 2015 | 25 | 131 | 551 | 1,653 | 7,799 | 1,361 | 11,520 |
| 2016 | 39 | 134 | 636 | 1,748 | 8,164 | 1,370 | 12,091 |
No/Expired Insurance
| Crash Year | Fatal Crashes | Incapacitating Injury Crashes | Non-Incapacitating Injury Crashes | Possible Injury Crashes | Non-Injury Crashes | Unknown Injury Crashes | Total Crashes |
| 2010 | 82 | 340 | 1,398 | 3,034 | 7,788 | 1,096 | 13,738 |
| 2011 | 78 | 286 | 1,191 | 2,801 | 7,600 | 1,087 | 13,043 |
| 2012 | 90 | 402 | 1,503 | 3,742 | 9,188 | 1,427 | 16,352 |
| 2013 | 74 | 293 | 1,518 | 3,727 | 10,145 | 1,631 | 17,388 |
| 2014 | 72 | 364 | 1,620 | 4,275 | 11,765 | 1,665 | 19,761 |
| 2015 | 69 | 422 | 1,583 | 4,322 | 13,291 | 1,892 | 21,579 |
| 2016 | 103 | 423 | 1,801 | 4,538 | 13,997 | 1,869 | 22,731 |
Both No/Expired Insurance and Hit-and-Run
| Crash Year | Fatal Crashes | Incapacitating Injury Crashes | Non-Incapacitating Injury Crashes | Possible Injury Crashes | Non-Injury Crashes | Unknown Injury Crashes | Total Crashes |
| 2010 | 13 | 40 | 210 | 520 | 2,144 | 557 | 3,484 |
| 2011 | 16 | 48 | 216 | 648 | 2,704 | 566 | 4,198 |
| 2012 | 10 | 73 | 352 | 1,021 | 3,656 | 799 | 5,911 |
| 2013 | 20 | 55 | 370 | 1,012 | 4,248 | 871 | 6,576 |
| 2014 | 21 | 80 | 423 | 1,234 | 5,135 | 912 | 7,805 |
| 2015 | 17 | 95 | 391 | 1,273 | 5,939 | 981 | 8,696 |
| 2016 | 33 | 107 | 487 | 1,344 | 6,432 | 1,033 | 9,436 |
The following tables are derived from the tables above
Percentage of hit and run with no/expired insurance
| Crash Year | Percentage Uninsured |
| 2010 | 65.2 |
| 2011 | 73.5 |
| 2012 | 76.2 |
| 2013 | 75.7 |
| 2014 | 77.1 |
| 2015 | 75.4 |
| 2016 | 78.0 |
On average 74.44{997ab4c1e65fa660c64e6dfea23d436a73c89d6254ad3ae72f887cf583448986} of the hit and run accidents involve uninsured drivers.
However, the following table is more troubling.
Percentage of no/expired insurance drivers who run.
| Crash Year | Percentage Run |
| 2010 | 38.8 |
| 2011 | 43.7 |
| 2012 | 47.4 |
| 2013 | 49.9 |
| 2014 | 51.1 |
| 2015 | 53.3 |
| 2016 | 53.1 |
The number of uninsured drivers who run is steadily increasing. This suggests either 1) drivers do not fear the consequences of running or 2) an underlying situation exists that makes the fear of staying more compelling than the fear of running. (Outstanding warrant as an example.)
So can be done to reduce the number of hit-and-run accidents? Given the high incidence of uninsured drivers simply looking for that sliver of drivers will reduce the rate. This can be accomplished by focusing law enforcement personnel in areas more likely to have the violators. Simply have officers positioned in the ‘U’ turns under the main highways and check for registration stickers.
Another option is to do a warrant roundup with the option to voluntarily appear and make arrangements before the roundup begins. Removing the fear of consequences for staying will lead to less drivers running. As a bit of lagniappe, both ways generate revenue for the City and the former encourages insurance rates to rise while the latter gives individuals an opportunity to clear the slate and void future peril.
Disclaimer (taken directly from TxDOT)
Federal highway safety laws require the state to create this crash database for use in obtaining federal safety improvement funds. Section 409 of Title 23 of the United States Code, forbids the discovery and admission into evidence of reports, data, or other information compiled or collected for activities required pursuant to Federal highway safety programs, or for the purpose of developing any highway safety construction improvement project, which may be implemented utilizing federal-aid highway funds, in tort litigation arising from occurrences at the locations addressed in such documents of data. Information that is not available to a party in civil litigation may be confidential under state law pursuant to Tex. Gov’t. Code Sec. 552.111.