The current Coronavirus madness has reached fever pitch, and the reaction is doing more harm than the virus. This is a classic fear contagion, almost identical to the initial response to the H1N1 swine flu back in 2009. Cooler heads prevailed in 2009, and they should do so today. Take some time to read the link above. It notes that the initial reaction was to close schools for 2 weeks, but that at the request of the White House a delay to see the severity of the virus occurred. The delay showed that closing the schools and starting the fear spread would have been the wrong call. That same reasoning can be applied to the Coronavirus.
What do the numbers tell us?
I. Initial reports were scary
Just like in 2009 the initial numbers were grim. According to the Centers for Disease Control as of 4:00 PM March 10 the US has 938 reported cases of Coronavirus resulting in 29 deaths, for a three percent mortality rate. (Note: The link should update the numbers daily.) At first glance this seems like a very high mortality rate. However, a couple of important considerations show that the mortality rate is artificially high compared to where it is likely to settle. First, 23 of the 29 deaths are from the Life Care Center of Kirkland, Washington. This lets us know that the mortality rate is skewed to the high side because they are coming from a population with underlying medical conditions.
Second, the number of reported cases is doubtless too low as the CDC notes, “Reported illnesses have ranged from very mild (including some with no reported symptoms) to severe, including illness resulting in death.” The combination of underreporting the number of cases (because they are so mild) along with the concentration of deaths coming from a nursing home is creating an artificially high mortality rate that isn’t going to be sustained.
II. What has happened since
In any disease outbreak the initial numbers are high, and then they lower to a baseline level before the disease is contained. One important factor in disease spread for Coronavirus is the rate of viral shedding. The Lancet has published a study showing that the mean time for viral shedding is 20 days. With the first cases reported on February 15th, we are now one month into the disease life cycle, and some segment of the infected population has shed the virus and have built up antibodies as a result of the infection. With an unknown amount of individuals who had such a mild case of the disease that they didn’t know they were infected there’s an unknown and growing amount of people who are now resistant to becoming infected.
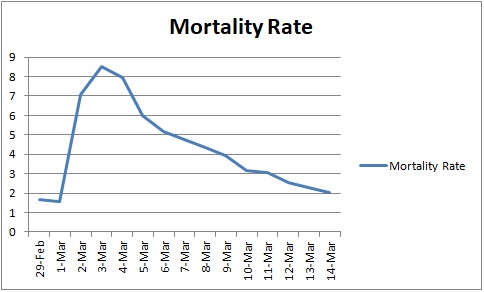
What do the numbers say regarding the infection and mortality rates on an ongoing basis? Four charts tell the story of the disease progression. In the charts below all numbers are as percentages. First, the mortality rate has dropped as it should. The initial deaths were artificially high because of the outbreak in the nursing home. Looking at the change over time we see that the mortality rate dropped after the nursing home spike and continues to drop.

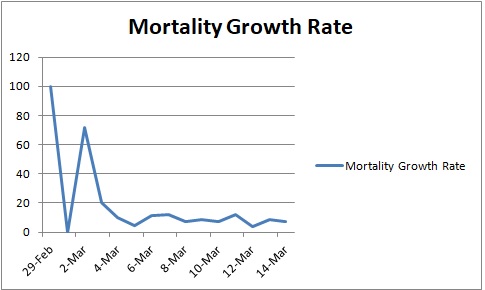
The initial mortality rate topped 8% at one point. That’s scary and deserves monitoring and quick action if necessary. However, as expected the rate has dropped and the fear associated with the high mortality rate is shown to be unwarranted. But since the mortality rate data is skewed because of the initial spike we need to look at another value to see what the functional status of the threat is. Looking at the mortality growth rate gives us better data to work with to see what the ongoing threat level looks like.

This number is always positive because the dead don’t come back to life. The rate simply looks at the number of dead from the disease on the given day as a percentage of the total number of dead from the disease. This measure is used to show if the disease is becoming more or less lethal. This is also subject to artificial spikes in a vulnerable population is afflicted with the disease, such as what happened in the nursing home. We see the initial spike of deaths from the nursing home at the beginning of the chart, and that the rate has settled into a range that is unsteadily dropping.
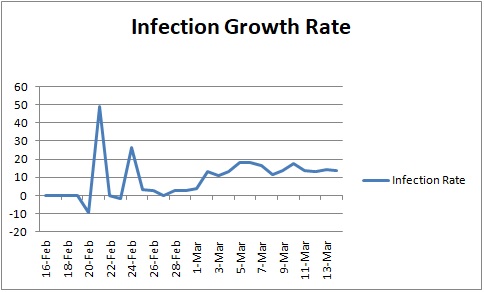
While the mortality rate is the scary end result the vase number of infected do not die. To get a better idea of disease status we need to look at what is happening with the overall infection rate. While the overall number of infections is increasing have we crossed a tipping point were the infection rate is accelerating and we have an out of control situation? Looking at the infection growth rate the answer is clearly no.

This number can go negative as people recover from the disease. While the initial outbreak showed a spike in infections as we became aware the disease made its way to the US, we see that the infection growth rate has stabilized. Although the rate initially was accelerating as disease awareness spread and individuals started taking precautions such a practicing basic hygiene the rate stabilized.
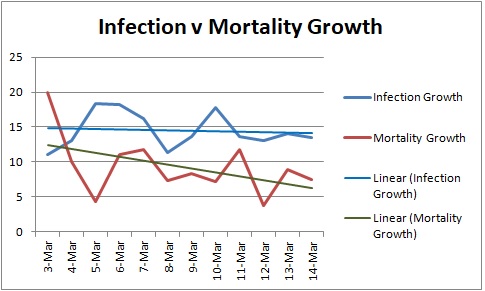
Our last chart is to look at the infection versus mortality growth rates after the initial spikes, this time with trend lines added.

Once the spikes are eliminated the growth rates show that the situation is under control. The trend lines are down. While some degree of precautions is necessary to make sure our medical facilities don’t become overwhelmed the situation appears to be contained. As the number of previously infected individuals who have shed the virus rises the overall threat level drops.
Mortality rate is a misleading figure
The overall mortality rate is also only a part of the picture. Adjusting the risk by age is a better way to assess risk. While the numbers in the US are too small to have a meaningful analysis looking at worldwide numbers are enough to do an analysis. Looking at these numbers shows that the mortality risk skews significantly towards the older age groups. In the above link the mortality probability by age group is as follows: (NOTE this is risk of death, not a representation of deaths that have occurred)
|
AGE
|
DEATH RATE confirmed cases |
DEATH RATE all cases |
|
80+ years old
|
21.9%
|
14.8%
|
|
70-79 years old
|
8.0%
|
|
|
60-69 years old
|
3.6%
|
|
|
50-59 years old
|
1.3%
|
|
|
40-49 years old
|
0.4%
|
|
|
30-39 years old
|
0.2%
|
|
|
20-29 years old
|
0.2%
|
|
|
10-19 years old
|
0.2%
|
|
| 0-9 years old |
no fatalities
|
*Death Rate = (number of deaths / number of cases) = probability of dying if infected by the virus (%). The percentages do not have to add up to 100%, as they do NOT represent share of deaths by condition.
The risk of death for anyone under 50 is virtually non-existent, and doesn’t become statistically significant until 60 years old. Even then, it’s possible to further subdivide the age groups by underlying comorbidity (or lack thereof) and reduce the mortality rate in the age groups by individual health condition. The same source produced this comorbidity chart to show which comorbidities were more dangerous.
|
PRE-EXISTING CONDITION
|
DEATH RATE confirmed cases |
DEATH RATE all cases |
|
Cardiovascular disease
|
13.2%
|
10.5%
|
|
Diabetes
|
9.2%
|
7.3%
|
|
Chronic respiratory disease
|
8.0%
|
6.3%
|
|
Hypertension
|
8.4%
|
6.0%
|
|
Cancer
|
7.6%
|
5.6%
|
|
no pre-existing conditions
|
0.9%
|
*Death Rate = (number of deaths / number of cases) = probability of dying if infected by the virus (%). The percentages do not have to add up to 100%, as they do NOT represent share of deaths by condition.
If you are a young (or youngish) individual who otherwise is in reasonable health the virus isn’t a threat.
What is an Appropriate Response
Anytime there’s a threat some response is warranted. The key in crisis management is responding appropriately so that the response is not worse than the threat. While we don’t think about it in such cold terms regulation and response occurs in a what number of illness and/or death is acceptable framework. Take environmental protection issues as an example. You can’t regulate to a zero point otherwise society as we know it would be drastically altered. Pollution levels that allow for X deaths and Y illnesses is tolerated because some portion of society is vulnerable to the impact of the pollutants. That framework gives us guidance for how to respond to the current threat.
Age and underlying conditions make individuals more susceptible. In our case, my kiddo has no large intestine, and my better half is less that one month pregnant. These are two potentially high risk situations. Because of that we are choosing to avoid public contact as much as possible. However, would it be appropriate to have mass regulation and declare a state of emergency to protect the segment of the population that has no large intestine or is less than one month pregnant? That answer should be no. The individually susceptible people can take protective measures to protect themselves. This holds true regardless of the individual susceptibility.
Harm from the Response
The harm from the response arguably outweighs any good that has been achieved. While it’s easy to point to the big ticket harm from the virus response (NCAA tournament excluding fans, the Rodeo shut down, etc) those impacts are a one off. The NCAA and Rodeo will feel a financial hit, and be back as good as ever next year. The long lasting harm comes from the avoidance of businesses that are incorrectly associated with potential Coronavirus threat. Chinatown is being hit especially hard by the fear driven response.

This picture was taken on a Saturday night at the end of the 8:00 hour. Normally, the establishment would be teeming with customers. The manager was kind enough to talk with me about the damage the fear response is causing. She said that a Twitter post back in January that the virus was in Chinatown caused business to fall by half. Even when the Twitter post was established to be false business didn’t pick up. With the virus actually arriving in the area business has dropped even more. And she’s one of the less impacted establishments. She said that talking with her insurance provider some businesses have seen a 70% reduction in business. Restaurants have small profit margins, this type of downturn is business places establishments in serious jeopardy. She noted that three establishments have closed because of the business downturn. The longer Coronavirus madness lasts the greater the impact on the businesses and more closures will result.
Now that schools have been cancelled the problem becomes more magnified. The economic impact of school closure is going to be significant. Schools have the primary purpose of educating students, but they also provide some important secondary benefits. Schools have possession of the students for the bulk of working hours. This allows the students guardians to work without having to pay for daycare. With the schools closed, and other options to watch over the students not offered for fear of mass gatherings, individuals are going to have to miss work in order to watch their children. This is going to quickly lead to economic harm and then crisis to a significant number of those impacted.
Schools also provide free breakfast and lunch to the needy. The sudden lack of food service is going to leave children hungry. While some measure of respite could have been found from the charitable segment of society the city has the charitable feeding ban in place. Also, the desire to avoid mass gatherings creates logistical problems even if some organization could navigate the restrictions in place and provide the meals.
What can we do
It’s time that we as a society stop living in fear and start being considerate of others. The panic buying is absurd. But more importantly we can start taking affirmative actions to support those in need. Pasadena ISD is providing curbside food for their students while the schools are closed. Props to them for looking out for their students needs. We should follow their lead and help those in need. If you aren’t one of the vulnerable in society, and can afford to do so, make a point to spend your entertainment/out to eat budget now while the businesses are hurting. Going to Chinatown is safe, and the food there is great. While they are hurting doubtless more establishments area wide will also start to suffer as the economic impact by the local government starts to be felt. Let prudence, not fear, guide your decisions. Live life as you would within the bounds of prudence. Don’t miss out on all the great experiences life has to offer.
Oh, and if you do go to Chinatown, dumplings on top of salad is a great combination.
