

In the past I was a meteorologist. A lot of time was spent in news stations, and the general decline in journalism integrity took a long time to reach the weather department, but when it comes to tropical systems the rush for ratings over integrity has, as a general principle, come to take a foothold in dealing with tropical systems. While this saddens me on many levels one of the most troublesome aspects of the ratings chase means that systems are hyped up and good, reliable information is a partial casualty to the process. To that end, I offer an introduction in how to read hurricane models and some of the background information that goes into the official forecast produced by the National Hurricane Center.
To begin with, a few things to keep in mind when looking at tropical system. Systems travel in the direction of the mean atmospheric flow. Think suspending a ball in a river. The river will carry the ball along by the flow of the river. The different speeds the river is flowing at different depths will all impart steering on the ball, and the ball will flow the speed and direction of the cumulative impact of the different forces pushing it along. A good proxy for the mean atmospheric flow is the winds at the 500 millibar level.
Hurricanes generally strengthen when there’s warm water below, and high pressure aloft. A tropical system has to evacuate the rising air and that’s accomplished by high pressure. Hurricanes are fed by latent heat of the individual storms comprising the hurricane. This means they need to have no-to-little wind shear (a change in wind speed or direction with height.)
When looking at hurricanes, three things are important. Storm movement (where is it going), storm strength (what’s the sustained winds), and how big is it (how far from the center will uncomfortable weather conditions exist.) To try and answer the first two questions meteorologists turn to weather models. This post will cover the first point only.
Before giving value to the models we first need to know what the abbreviations mean. Some models are reliable, others not so much. Just simply looking at the model spread will not give meaningful information because the reliable models and unreliable models are lumped together. For this reason rather than looking up a spaghetti plot with preexisting models already displayed it’s more fruitful to go to a page such as Tropical Atlantic and to plot the models that are reliable.
A few things to keep in mind when looking at the plots. When a system is forming the models sometimes have a difficulty initializing the center so give iffy output. Once a system is well organized the models usually will have a good handle on where the system is. Look at the overall picture the model is painting and avoid getting caught up in the wiggles. A hurricane will wobble, but predicting the wobbles is impossible. Look for run to run consistency. No matter how well a model performs if it is giving drastically different solutions run to run it doesn’t have a good handle on the situation. Look for realistic looking output. Having said that, here’s a few pointers to help you out in looking at models.
The model spread is used to establish the cone of probability for a system.
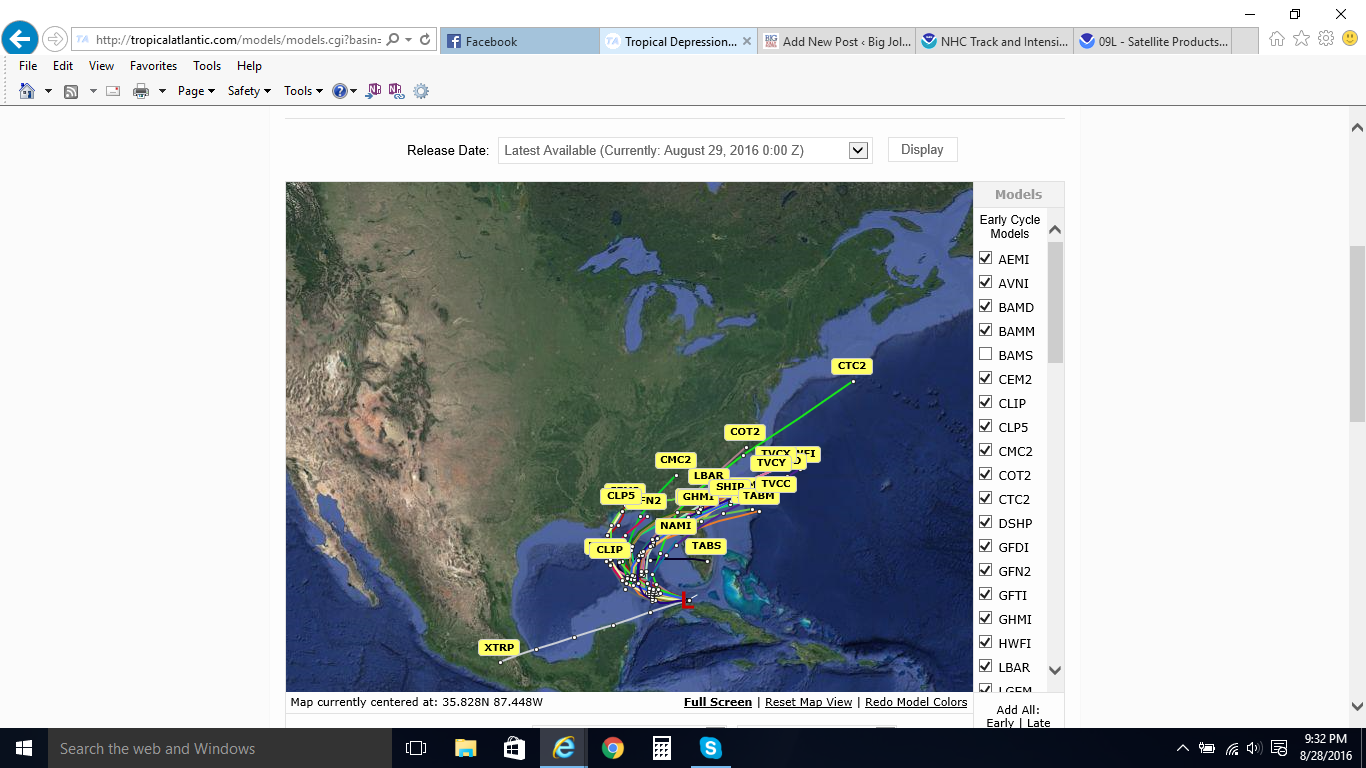

Note how the models have a nice cone spread, but also how they are not accurately reflecting the current motion of the storm.
Sometimes the models will be split into two camps. When this happens you have to look at the underlying meteorological conditions and decide which camp is more likely accurate. Look at reliable versus unreliable models, run to run consistency and trends, and handle on the system.
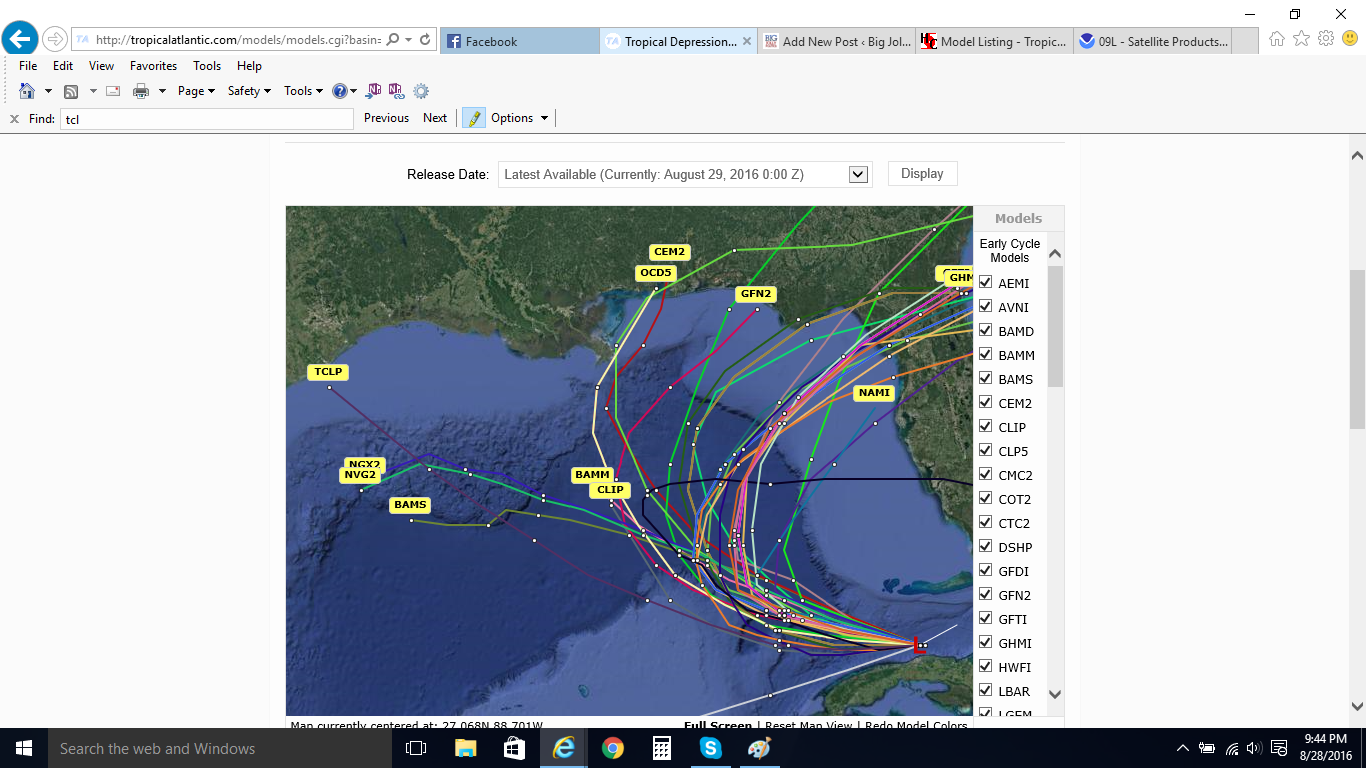
Here although there’s a west trajectory camp, it consists of mostly unreliable models and the run to run trends have been favoring the recurvature camp.
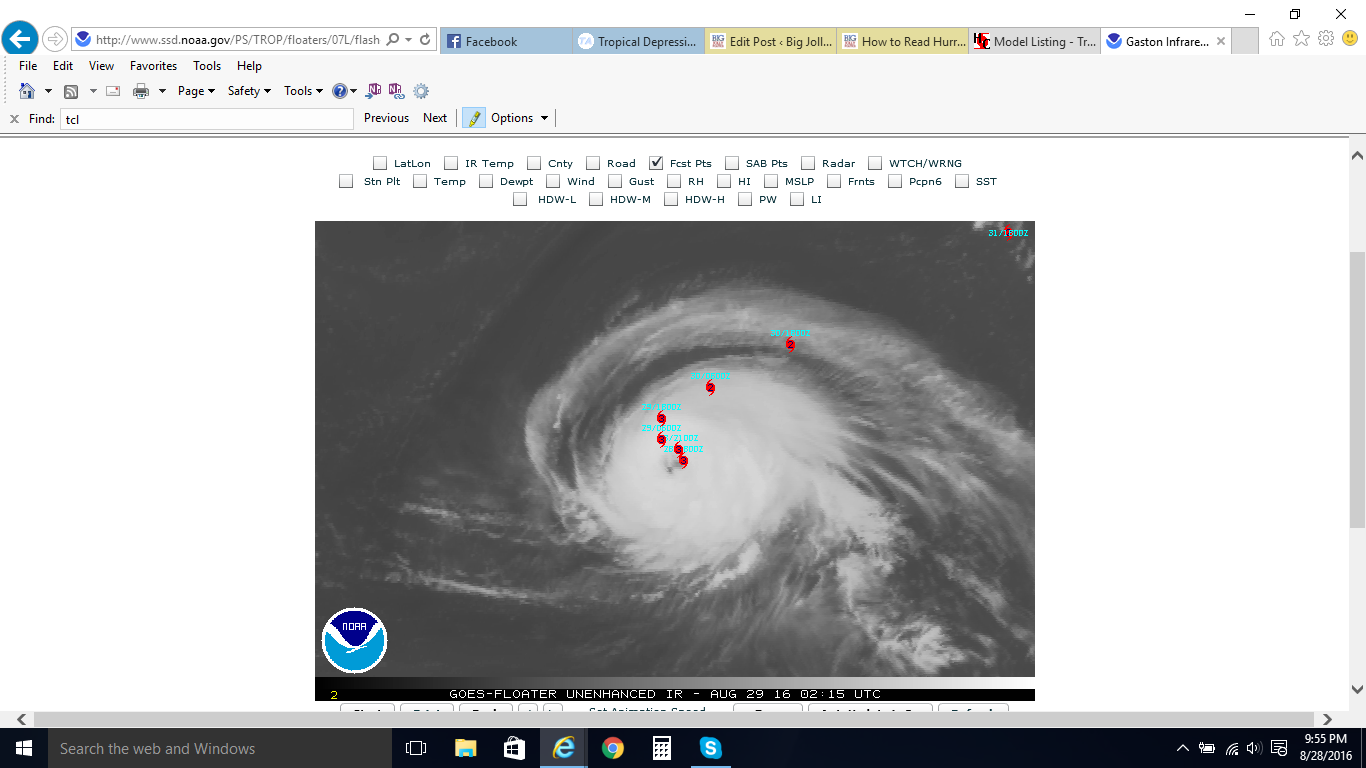
Regardless of what the models say, they have to verify. If they don’t then the model output isn’t of any useful value. The same holds true for the official forecast, but for different reasons. Once the hurricane center has an established forecast track the rules of continuity apply and the forecast can only be adjusted so much each update. This means that an individual forecaster can not believe in the forecast he is giving, but must give the forecast to fall in line with the rules. This is why you can see a slow but steady change in forecasted track over the course of a day… the forecast movement should be significantly different, but it takes 2-4 change cycles to both generate an accurate forecast as well as comply with the rules. To get a handle on how well the forecast is verifying simply go to the satellite page on the national hurricane center web page and click on the storm floater link. From there click on the storm of interest and then click the fcst pts box to have the forecast points appear on the image loop. Often times the hurricane center’s forecast is spot on
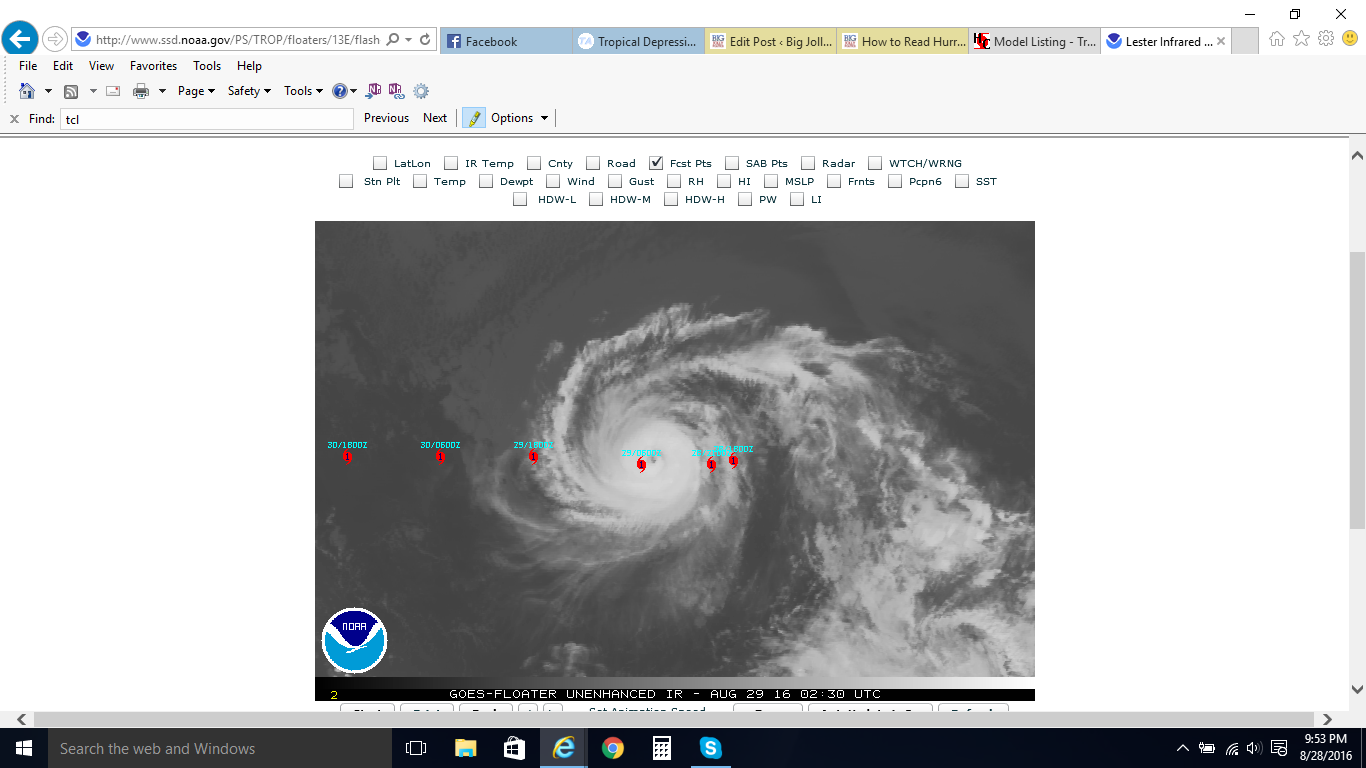
Nailed the forecast.
Sometimes the position is way off.
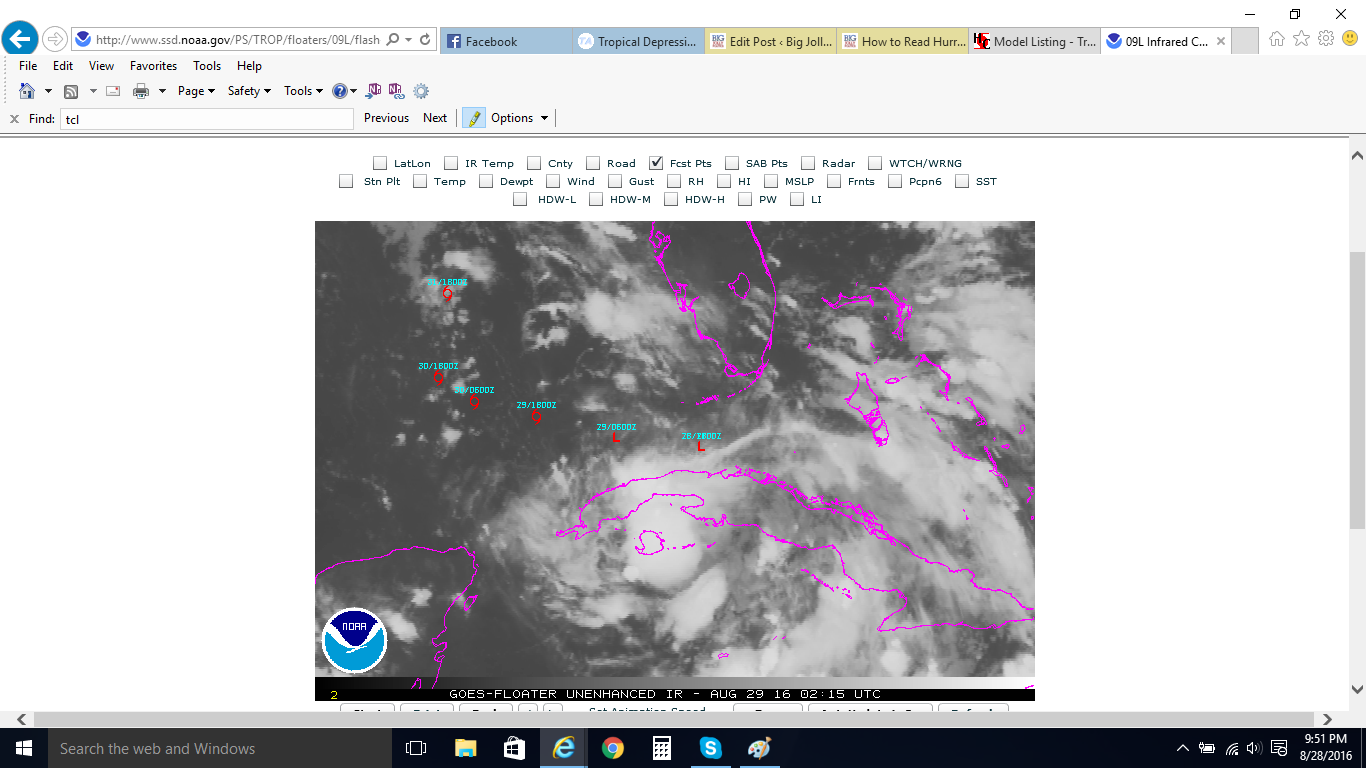
To be fair, this is a newly formed system and the center may be reforming south of Cuba. Or at least is being pulled southward towards the blossoming convection south of Cuba within the overall westward gross storm motion.
Sometimes the forecast is only slightly off. These are the ones to be concerned about. Models and forecasts will end up with a bias for each specific storm. If cycle after cycle the forecast position has the same error relative to actual storm motion it’s a warning sign that either bias has set in with the forecast, or the rules are constraining the forecast.
This is a close forecast. This is the type of miss that is important to watch for consistency in the miss to alert to bias or rules constraint. Here, neither is in play, the storm is in a weak steering current and it’s moving erratically.
Once a storm is well developed, the models will usually have a good handle on the system. Just keep an eye out for outliers and disregard them in the plotting. Check the actual storm motion against the predicted storm motion for potential red flags regarding bias or rules issues. Doing these simple checks will give a good idea of the potential landfall area. While the actual forecasting has significantly more nuance involved, this is a good way to go and get unbiased information that is free of the drive for ratings.